Thursday 7 June 2012

Options Trading Account Levels

When you apply for a brokerage account, brokerage firm will assign you the account trading level ranging from level 1 to level 5 based on your Trading Experience and Net Worth.

Level 1

Level 2
  • Level 1 
  • Calls and Puts Buying
  • Writing of cash Covered Puts 
  • Purchases of straddles or combinations

Level 3
  • Levels 1 and 2
  • Equity DEBIT spreads 
  • Covered Put writing

Level 4
  • Levels 1, 2, and 3, 
  • Equity CREDIT spreads, 
  • Naked (uncovered) writing of equity options 
  • Uncovered writing of straddles or combinations on equities

Level 5
  • Levels 1, 2, 3, and 4, 
  • Uncovered writing of index options, 
  • Uncovered writing of straddles or combinations on indexes, and index spreads.

Wednesday 6 June 2012

Long Iron Condor


Outlook: Neutral

Long Iron Condor  -  Buy one lower strike put, sell one middle lower strike put, sell one higher middle strike call  and buy one higher strike call.
     
Strategies...

  •              Buy ONE lower Strike Put (OTM)
  •              Sell ONE lower middle strike Put (OTM) with same expiration.
  •              Sell ONE higher middle strike Call (OTM) with same expiration.
  •              Buy ONE higher Strike Call (OTM) with same expiration.
  •              Seeking for little movement in the stock.
  •              Maximum profit if the the stock at between the lower middle and higher middle strike price.
  •              Preferably options with one month or less to expiration.

Linkedin Corporation(NYSE:LNKD), is traded at $92.50 on June, 2012. To do a Long Iron Condor.

  • Buy July 2012 $85 Put at $1.40.
  • Sell July 2012 $90 Put at $2.60.
  • Sell July 2012 $95 Call at $2.20.
  • Buy July 2012 $100 Call at $0.80.

Long Iron Condor

Long Iron Condor

 Advantages...

  •             Profit from little movement in the stock.
  •             Premium gain and capped downside risk.

Disadvantages...
  •             Narrow range for high profit.

Premium Gain:            $2.60 + $2.20 - $1.40 - $0.80 = $2.60

Maximum Profit:         Premium gain

Maximum Loss:          $5.00 - $2.60 = $2.40
                                     (Different in strike - premium gain)
                         
Breakeven Up:            $95.00 + $2.60 = $97.60
                                     (Upper Middle Strike Price +  Premium gain)

Breakeven Down :       $90.00 - $2.60 = $87.40                          
                                      (Lower Middle Strike Price -  Premium gain)

Long Iron Butterfly


Outlook: Neutral

Long Iron Butterfly  -  Buy one lower strike put, sell one middle strike put, sell one middle strike call  and buy one higher strike call.
     
Strategies...

  •              Buy ONE lower Strike Put (OTM)
  •              Sell ONE middle Strike Put (ATM) with same expiration.
  •              Sell ONE middle Strike Call (ATM) with same expiration.
  •              Buy ONE higher Strike Call (OTM) with same expiration.
  •              Seeking for little movement in the stock
  •              Maximum profit if the the stock at middle strike price.
  •              Preferably options with one month or less to expiration.


Yum! Brands, Inc.(NYSE:YUM), is traded at $65 on June, 2012. To do a Long Iron butterfly.
  • Buy July 2012 $60 Put at $1.20.
  • Sell July 2012 $65 Put at $2.70.
  • Sell July 2012 $65 Call at $3.00.
  • Buy July 2012 $70 Call at $0.95.

Long Iron Butterfly
Long Iron Butterfly
 Advantages...

  •             Profit from little movement in the stock.
  •             No cost and low downside risk.

Disadvantages...

  •             Narrow range for high profit.


Premium Gain:            $2.70 + $3.00 - $1.20 - $0.95 = $3.55

Maximum Profit:         Premium gain

Maximum Loss:           $5.00 - $3.55 = $1.45
                                   (Different in strike - premium gain)
                         
Breakeven Up:            $65.00 + $3.55 = $68.55
                                   (Middle Strike Price +  Premium gain)

Breakeven Down :       $65.00 - $3.55 = $61.45                          
                                    (Middle Strike Price -  Premium gain)

Long Put Butterfly


Outlook: Neutral

Long Put Butterfly  -  Buy One lower strike put, sell two middle strike puts and buy one higher strike put.
     
Strategies...
  •              Buy ONE lower Strike Put (OTM)
  •              Sell TWO middle strike Puts (ATM) with same expiration.
  •              Buy ONE higher Strike Put (ITM) with same expiration.
  •              Seeking for little movement in the stock
  •              Maximum profit if the the stock at middle strike price.
  •              Preferably options with one month or less to expiration.


McDonald's Corporation (NYSE:MCD), is traded at $85 on June, 2012. To do a long put butterfly.


  • Buy July 2012 $80 Put at $0.45.
  • Sell July 2012 $85 Put at $1.15.
  • Buy July 2012 $90 Put at $3.25.

Long Put Butterfly

Long Put Butterfly

 Advantages...

  •             Profit from little movement in the stock.
  •             Low cost.

Disadvantages...

  •             Narrow range for high profit.


Premium Paid:            $0.45 - ($1.15 x 2) + $3.25 = $1.40

Maximum Profit:         $5.00 - $1.40 = $3.60
                                  (Different in strike - net premium paid)

Maximum Loss:           Net Premium paid
                         
Breakeven Up:            $90.00 - $1.40 = $88.60
                                   (Higher Strike Price -  Premium paid)

Breakeven Down :       $80.00 + $1.40 = $81.40                            
                                   (Lower Strike Price + Premium paid)


Sunday 3 June 2012

Long Call Butterfly

Outlook: Neutral

Long Call Butterfly  -  Buy One lower strike call, sell two middle strike calls and buy one higher strike call
       
Strategies...
  •              Buy ONE lower Strike Call (ITM)
  •              Sell TWO middle strike Calls (ATM) with same expiration.
  •              Buy ONE higher Strike Call (OTM) with same expiration.
  •              Seeking for little movement in the stock
  •              Maximum profit if the the stock at middle strike price.
  •              Preferably options with one month or less to expiration.

McDonald's Corporation (NYSE:MCD), is traded at $85 on June, 2012. To do a long call butterfly.

  • Buy July 2012 $80 Call at $7.30.
  • Sell July 2012 $85 Call at $3.40.
  • Buy July 2012 $90 Call at $1.05.
Long Call Butterfly


Long Call Butterfly


 Advantages...
  •             Profit from little movement in the stock.
  •             Low cost.
Disadvantages...
  •             Narrow range for high profit.

Premium Paid:            $7.30 - ($3.40 x 2) + $1.05 = $1.55

Maximum Profit:         $5.00 - $1.55 = $3.45
                                  (Different in strike - net premium paid)

Maximum Loss:           Net Premium paid
                          
Breakeven Up:            $90.00 - $1.55 = $88.45
                                   (Higher Strike Price -  Premium paid)

Breakeven Down :       $80.00 + $1.55 = $81.55                             
                                   (Lower Strike Price + Premium paid)


Short Guts

Outlook: Neutral

Short Guts  -  Sell In-the-Money Strike Calls, Sell In-the-Money Strike Put.
        
Strategies...

  •          Sell lower Strike Call (ITM)
  •          Sell higher Strike Put (ITM) with same expiration.
  •          Seeking for sideways movement of the stock
  •          Unlimited downside risk, capped profit.

Example...

Best Buy Co., Inc.(NYSE:BBY) is traded at $18.30 on June 1, 2012. To short a Guts,

  •     Sell June 16, 2012 $17 Call at $1.40.
  •     Sell June 16, 2012 $20 Put at $2.00.
Short Guts
Short Guts

Advantages...

  •         Profit from sideways movement of the stock.
  •         Received options premium

Disadvantages...

  •         High-risk strategy
  •         Unlimited risk if stock moves in either direction


Maximum Profit:          $1.40 + $2.00 - $3.00 = $0.40
                                  (Call Premium + Put Premium - Different in strikes)

Maximum Loss:           Uncapped
                            
Breakeven Up:            $20.00 + $3.40 - $3.00 = $20.40
                                   (Higher Strike Price +  Premium gain - Different in strike)

Breakeven Down :       $17.00 - $3.40 + $3.00 = $16.60                                
                                   (Lower Strike Price - Premium gain + Different in strike)


Short Strangle

Outlook: Neutral

Short Strangle -   Sell Lower Strike Put, Sell Higher Strike Call
             
Strategies...

  •         Sell lower strike Puts (OTM)
  •         Sell Higher Strike Calls (OTM)
  •         Looking for sideways movement of the stock.       
  •         Make profit with rangebound in stock trend
    
Example...

Best Buy Co., Inc.(NYSE:BBY) is traded at $18.30 on June 1, 2012. To short a strangle,
  •     Sell June 16, 2012 $20 Call at $0.15.
  •     Sell June 16, 2012 $17 Put at $0.23.
Short Strangle


Short Strangle

  
Advantages...

  •     Profit from sideways movement of stock.
  •     Receive options premium immediately

Disadvantages...
  •    High-risk strategy and unlimited loss.
  •    Uncapped risk

Maximum Profit:          $0.15 + $0.23 = $0.38
                                     (Call Premium + Put Premium)

Maximum Loss:           Uncapped
                             
Breakeven Up:             $20.00 + $0.38 = $20.38
                                     (Higher Strike Price +  Premium gain)

Breakeven Down :       $17.00 - $0.38 = $16.62                                 
                                    (Lower Strike Price - Premium gain)


Short Straddle

Outlook: Neutral

Short Straddle - Short Calls and Puts with the SAME Strike Price and Expiration Date.
            
Strategies...

  •     Sell ATM Call and Put with one month or less to expiration.
  •     Looking for NO movement in the stock.
  •     Time decay is helpful to short straddle.
  •     Uncapped downside risk, capped profit.

Example...

Best Buy Co., Inc.(NYSE:BBY) is traded at $18.30 on June 1, 2012. To short a straddle,

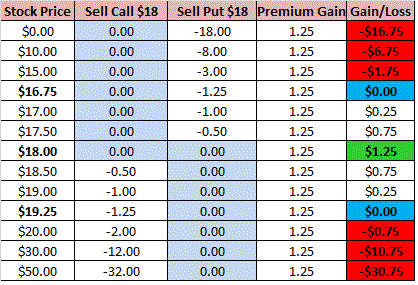
  •     Sell June 16, 2012 $18 Call at $0.70.
  •     Sell June 16, 2012 $18 Put at $0.55. 

Short Straddle


Advantages...

  •     Profit from sideways movement of stock.
  •     Receive options premium immediately

Disadvantages...

  •     High-risk strategy and unlimited loss.
  •     Only suitable for advanced options trader


Maximum Profit:          $0.70 + $0.55 = $1.25
                                   (Call Premium + Put Premium)
 
Maximum Loss:           Uncapped
                              
Breakeven Up:             $18.00 + $1.25 = $19.25
                                   (Strike Price +  Premium gain)

Breakeven Down :       $18.00 - $1.25 = $16.75                                  
                                   (Strike Price - Premium gain)


Friday 1 June 2012

Long Guts


Outlook: Neutral

Guts  -  Buy In-the-Money Strike Calls, Buy In-the-Money Strike Put.
          -  An adjustment strategy to Strangle

Strategies...
  •      Buy lower Strike Calls (ITM)
  •      Buy higher Strike Put (ITM) with same expiration.
  •      Seeking for high volatility stock (trade before announcment of earning reports or new event)
  •      Make profit with stock soaring up or plummeting down. 
  •      Limited downside risk, uncapped upside potential profit.
Example...

Exxon Mobil Corporation(NYSE:XOM) is traded at $78.50 on June, 2012. To do a Guts, you

  •         Buy Oct 2012 $75 Calls at $6.50.
  •         Buy Oct 2012 $80 Puts at $5.20.
Long Guts
Long Guts

Advantages...
  •     Profit from volatile stock's movement.
  •     Uncapped potential profit

Disadvantages...
  •     Very expensive - ITM Options are much more expensive than ATM options
  •     Significant movement of stock to cover all costs.
  •     Time decay accelerates as options close to expiration.


Maximum Profit:         Uncapped Profit

Maximum Loss:          $6.50 + $5.20 - $5 = $6.70
                                     (Premium Paid - Different in strike)

Breakeven Up:           $80 + ($11.70 - $5) = $86.70    
                                     [Higher Strike + (Premium Paid - different in strike)]

Breakeven Down:      $75 - ($11.7 - $5) = $68.30                                
                                    [Lower Strike - (Premium Paid - different in strike)]


Thursday 31 May 2012

Long Strap

Outlook: Neutral to Bullish

Strap  -  Buy TWO Strike Calls, Buy ONE Strike Put.
          -  An adjustment strategy to Straddle , buying one more Call..
             

Strategies...

  •      Buy TWO Strike Calls (ATM)
  •      Buy ONE Strike Put (ATM) with same expiration.
  •      Strap is more expensive than straddle,only do strip when there is a big jump in stock price.
  •      Make profit with stock price moving in either direction, preferably to the upside movement.
  •      Limited downside risk, uncapped upside potential profit.


Example...

Oracle Corporation (NASDAQ:ORCL) is traded at $26.30 on May, 2012. To do a Strap, you

  •         Buy TWO Sept 2012 $26 Calls at $2.00.
  •         Buy ONE Sept 2012 $26 Put at $1.70.
Long Strap
Long Strap

Advantages...
  •     Profit from volatile stock's movement, preferably upside move.
  •     Uncapped potential profit

Disadvantages...
  •     Expensive - Buy TWO Calls & ONE Put (ATM)
  •     Significant movement of stock to cover all costs.
  •     Time decay accelerates as options close to expiration.

Maximum Profit:          Uncapped Profit

Maximum Loss:           $2.00 + $2.00 + $1.70 = $5.70
                                      (Two Call Premium + One Put Premium)

Breakeven Up:            $26.00 + $2.85 = $28.85
                                     (Strike Price + half Premium Paid)

Breakeven Down:       $26.00 - $5.70 = $20.30                                 
                                    (Strike Price - Premium Paid)

Long Strip

Outlook: Neutral to Bearish

Strip  -  Buy TWO Strike Puts, Buy ONE Strike Call.
         -  An adjustment strategy to Straddle , buying one more Put..
              
Strategies...
  •  Buy TWO Strike Puts (ATM)
  •  Buy ONE Strike Call (ATM) with same expiration.
  •  Strip is more expensive than straddle,only do strip when there is a big jump in stock price.
  •  Make profit with stock price moving in either direction, preferably to the downward movement.
  •  Limited downside risk, uncapped upside potential profit.

Example...

AT&T Inc. (NYSE:T) is traded at $34.10 on May, 2012. To do a Strip, you

  •     Buy ONE Aug 2012 $34 Call at $0.80.
  •     Buy TWO Aug 2012 $34 Put at $1.20.

Long Strip
Long Strip
 Advantages...
  •     Profit from volatile stock's movement, preferably downside
  •     Uncapped potential profit

Disadvantages...
  •     Expensive - Buy TWO Puts & ONE Call (ATM)
  •     Significant movement of stock to cover all costs.
  •     Time decay accelerates as options close to expiration.

Maximum Profit :        Uncapped Profit

Maximum Loss :         $0.80 + $1.20 + $1.20 = $3.20
                                    (Call Premium + Two Put Premium)

Breakeven Up :          $34.00 + $3.20 = $37.20
                                   (Strike Price +  Premium Paid)

Breakeven Down :     $34.00 - $1.60 = $30.80                                  
                                   (Strike Price - Premium Paid/2)


Long Strangle

Outlook: Neutral

Strangle -   Buy Lower Strike Put, Buy Higher Strike Call
               -   Adjusted strategy to Straddle, slightly cheaper
            
Strategies...
  •     Buy lower strike Puts (OTM)
  •     Buy Higher Strike Calls (OTM)
  •     Select highly volatile stock
  •     Strangle is cheaper than Straddle (buying OTM options in strangle, ATM  options in Straddle)
  •     Make profit with big move in stock in either direction.
  •     Limited downside risk, uncapped upside potential profit.

Example...

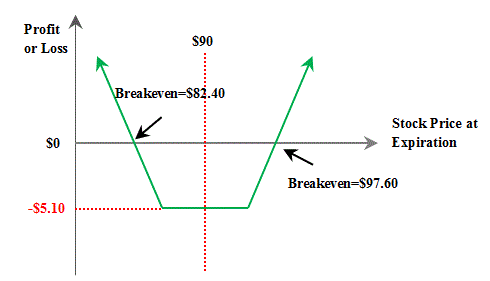
McDonald's Corporation (NYSE:MCD) is traded at $90.20 on May, 2012. To do a Strangle, you

  •     Buy Sept 2012 $92.50 Call at $2.10.
  •     Buy Sept 2012 $87.50 Put at $3.00.

(To do a Straddle, you buy Sept $90 Call at $3.30, and Sept $90 Put at $4.20. You pay more by using Straddle strategy)

Long Strangle


Long Strangle
Advantages...
  •     Cheaper than Straddle
  •     Profit from volatile stock's movement
  •     Uncapped potential profit
Disadvantages...
  •      Significant movement of stock to cover all costs.
  •     Time decay accelerates as options close to expiration.

Maximum Profit:          Uncapped Profit

Maximum Loss:          $2.10 + 3.00 = $5.10
                                     (Call Premium + Put Premium)

Breakeven Up:           $92.50 + $5.10 = $97.60
                                   (Strike Price +  Premium Paid)

Breakeven Down:      $87.50 - $5.10 = $82.40                                 
                                    (Strike Price - Premium Paid)


Long Straddle

Outlook: Neutral 

Straddle - Buy Calls and Puts with the SAME Strike Price and Expiration Date.
               - Most popular volatility strategy 

Strategies...


  • Buy at-the-money Call and Put with expiration 2-4 months away.
  • Do Straddle before any announcement of a company (to  profit from volatility of the stock)
  • Ensure movement of stock price is enough to cover the premium paid to both Call and Put.
  • Make profit with stock price moving in either direction.
  • Limited downside risk, uncapped upside potential profit.


Example...

Wal-Mart Stores, Inc.(NYSE:WMT) is traded at $65.70 on May, 2012. It's earning report will be released next week, to do a Straddle, you
  • Buy July 2012 $65 Call  at $2.00.
  • Buy July 2012 $65 Put at $1.40. 
Long Straddle 
Long Straddle

Advantages...
  • Profit from stock's movement
  • Uncapped potential profit

Disadvantages...
  • Pay options premium TWICE.
  • movement of stock must be significant to cover all costs. 
  • Time decay accelerates as options close to expiration.

Maximum Profit:          Uncapped Profit

Maximum Loss:           $2.00 + $1.40 = $3.40
                                      (Call Premium + Put Premium)

Breakeven Up:               $65 + $3.40 = $68.40
                                     (Strike Price +  Premium Paid)

Breakeven Down :              $65 - $3.40 = $61.60                                   
                                    (Strike Price - Premium Paid)


Tuesday 29 May 2012

What Is Options


What is Options...


Options is a derivative financial instrument that specifies a contract between two parties for a future transaction on an underlying stock at a reference price (the strike).

Call Options 

  • Call buyer has right to BUY underlying stock at reference price. 
  • Bullish - believe future stock price will rise higher than reference price


Put Options 

  • Put buyer has right to SELL underlying stock at reference price.
  • Bearish - believe future stock price will fall lower than reference price.


Vertical Strategies

Vertical Strategies - Buying or Selling a Call or Put Option with SAME Expiration Date but Different Strike Price.


Bear Put Ladder

Bear Put Ladder -  Sell lower strike Put, Sell middle strike Put, Buy higher strike Put

Strategies...


  •         Sell lower strike Put
  •         Sell middle strike Put with the same expiration date.
  •         Buy higher strike Put with the same expiration date.
  •         Extension to Bear Put Spread strategy by shorting another Put at lower strike.
  •         Short-term strategy, cause of uncapped risk.
  •         Maximum Profit if stock falls between the middle and lower strikes.

Example...


Amazon.com, Inc.(NASDAQ:AMZN) is traded at $215 on May 29, 2012.
  •             Sell Jun 2012 $200 Put option for $2.20.
  •             Sell Jun 2012 $210 Put option for $4.90.
  •             Buy Jun 2012 $220 Put option for $9.80.
Bear Put Ladder


How does Bear Put Ladder work...


Bear Put Ladder


Net premium paid:             $9.80-$4.90-$2.20=$2.70

Maximum Profit:                $220 - $210-$2.70=$7.30
                                             (Lower strike - (Higher strike - Middle strike) + net premium paid)

Maximum Loss:                  $200 -($220-$210) + $2.70 = $192.7
                                           (Lower strike - (Higher strike - Middle strike) + net premium paid)

Breakeven (Downside):      $200 - $7.30 = $192.7                                     
                                            (Lower strike - maximum profit)

Breakeven (Upside):         $220 - $2.70 = $217.30                                    
                                          (Higher strike  - net premium paid)


Bear Call Ladder

Bear Call Ladder -  Buy lower strike Call, Buy middle strike Call, Sell higher strike Call

Strategies...

  •         Sell lower strike Call (OTM)
  •         Buy middle strike Call with the same expiration date.
  •         Buy higher strike Call with the same expiration date.
  •         Extension to Bear Call Spread strategy by buying another call at higher strike.
  •         Longer-term strategy, cause we net long position.
  •         Make uncapped profit if stock price rises above higher strike.

Example...


Best Buy Co., Inc.(NYSE:BBY) is traded at $19.20 on May 29, 2012.


  •             Sell Sep 2012 $20 Call option for $1.49.
  •             Buy Sep 2012 $22 Call option for $0.84.
  •             Buy Sep 2012 $24 Call option for $0.44.
Bear Call Ladder


 How does Bear Call Ladder work...

Bear Call Ladder


Net premium gain:             $1.49 - $0.84 - $0.44 = $0.21

Maximum Profit:                Uncapped potential profit

Maximum Loss:                  $22 - $20 - $0.21 = $1.79
                                            (Middle strike - Lower strike - net premium gain)

Breakeven (Downside):      $20.00 - $0.21 = $19.79                                    
                                            (Lower strike - net premium gain)

Breakeven (Upside):         $24.00 + $1.79 = $25.79                                  
                                          (Higher strike  +  maximum loss)


Monday 28 May 2012

Bull Put Ladder

Bull Put Ladder -  Buy lower strike Put, Buy middle strike Put, Sell higher strike Put

Strategies...

  •         Buy lower strike Put(OTM)
  •         Buy middle strike Put (OTM) with the same expiration date.
  •         Sell higher strike Put (OTM) with the same expiration date.
  •         Bull Put Ladder is a Bull Put Spread with a additional put leg.
  •         Extension to Bull Put Spread strategy by buying another put at lower strike.
  •         Short-term income strategy

Example...

Microsoft Corporation (NASDAQ:MSFT) is traded at $29 on May 25, 2012.

  •             Buy July 2012 $24 Put option for $0.15.
  •             Buy July 2012 $26 Put option for $0.32.
  •             Sell July 2012 $28 Put option for $0.74.

Bull Put Ladder


How does Bull Put Ladder work...


Bull Put Ladder Table


Net premium gain:             $0.74 - $0.15 - $0.32 = $0.27

Maximum Profit:                $24 - $0.27 = $22.27
                                             (Lower strike - net premium gain)

Maximum Loss:                  $28 - $26 - $0.27 = $1.73
                                            (Higher strike - middle strike - net premium gain)

Breakeven (Downside):      $24.00 - $1.73 = $22.27                                     
                                            (Lower strike - maxium loss)

Breakeven (Upside):         $28.00 - $0.27 = $27.73                                     
                                          (Higher strike  - net premium gain)


Sunday 27 May 2012

Bull Call Ladder

Bull Call Ladder -  Buy lower strike Call, Sell middle strike Call, Sell higher strike Call

Strategies...

  •     Buy lower strike Call (either ATM or slightly OTM)
  •     Sell Middle Strike Call (OTM) with the same expiration date.
  •     Sell Higher Strike Call (further OTM) with the same expiration date.
  •     Expect stock rise to middle strike price but not above the short higher strike price.
  •     Preferably shorter term to expiration


Example...
JPMorgan Chase & Co.(NYSE:JPM) is trading at $33.50 on May 26, 2012.

  •         Buy June 2012 $34 Call option for $1.00.
  •         Sell June 2012  $36 Call option for $0.35.
  •         Sell June 2012  $38 Call option for $0.10.
Bull Call Ladder


How does Bull Call ladder work?

Stock price at $30...

  •             Buy  June 2012 $34 Call = Call not exercise, $0
  •             Sell  June 2012 $36 Call = Call not exercise, $0
  •             Sell June 2012 $38 Call = Call not exercise, $0
  •             Net premium paid: $1.0-$0.35-$0.10=$0.55
  •             Profit: -$0.55

Stock price at $34.55...

  •             Buy June 2012 $34 Call = Exercise call, gain $0.55
  •             Sell June 2012 $36 Call = Call not exercise, $0
  •             Sell June 2012 $38 Call = Call not exercise, $0
  •             Net premium paid: $1.0-$0.35-$0.10=$0.55
  •             Profit: $0.55-$0.55=$0

Maximum profit: Stock price between middle strike and higher strike ($36-$38), if stock price =$36

  •             Buy June 2012 $34 Call = Exercise call, gain $2
  •             Sell June 2012 $36 Call = Call not exercise, $0
  •             Sell June 2012 $38 Call = Call not exercise, $0
  •             Net premium paid: $1.0-$0.35-$0.10=$0.55
  •             Profit: $2-$0.55=$1.45

Stock Price at $39.45...

  •             Buy June 2012 $34 Call = Exercise call, gain $5.45
  •             Sell June 2012 $36 Call = Buyer exercise call, loss $3.45
  •             Sell June 2012 $38 Call = Buyer exercise call, loss $1.45
  •             Net premium paid: $1.0-$0.35-$0.10=$0.55
  •             Profit: $5.45-$3.45-$1.45-$0.55=$0

Stock price rise to $40...

  •             Buy June 2012 $34 Call = Exercise call, gain $6
  •             Sell June 2012 $36 Call = Buyer exercises call, loss $4
  •             Sell June 2012 $38 Call = Buyer exercises call, loss $2
  •             Net premium paid: $1.0-$0.35-$0.10=$0.55
  •             Profit: $6-$4-$2-$0.55=-$0.55

What if stock price rise to $100, your loss is -$60.55 (66-64-62-0.55). Maximum risk is uncapped cause you selling more calls than you're buying. The higher the stock price rise, the more money you lose.

Bull Call Ladder

Advantages...
  •         Lower cost
  •         Gain money from wider stock price range ($34.55-$39.45)
Disadvantage...
  •          Uncapped risk if stock price rises
  •          Only for advanced trader
  •          Not clear if we have a bullish or bearish strategy.

Maximum Profit:           $36-$34-$0.55=$1.45
                                     (middle strike - lower strike - net premium paid)

Maximum Loss:            UNLIMITED

Breakeven (Downside):  $34+$0.55=$34.55
                                         (Lower strike + net premium paid)

Breakeven (Upside):      $38+$36-$34-$0.55=$39.45
                                      (Higher strike + middle strike - lower strike - net premium paid)

Saturday 26 May 2012

Bear Call Spread

Outlook: Bearish or neutral to bearish

Bear Call Spread - Sell lower strike Call, Buy higher strike Call


Strategies...

  • Sell lower strike Call
  • Buy same number of higher strike call with the same expiration date.
  • Ensure trend is downward
  • Preferably with one month or less to expiration


Example...

Amazon.com, Inc. (NASDAQ:AMZN) is trading at $212 on May 26, 2012.

  •     Sell the Jun 2012 $220 call option for $3.50.
  •     Buy the Jun 2012  $230 call option for $1.15.

Bear Call Spread


Why Sell Jun $220 Call? You get instant premium = $3.50. You're obligated to sell the stock at $220 if stock price rise.

Why Buy Jun $230 Call? Capped upside risk. If price skyrocketed, you can exercise this option and buy back stock at $230.

How does Bear Call Spread work?

Stock price rise to $250...

  •         Sell the Jun 2012 $220 Call = Call exercised buy call buyer, loss $30
  •         Buy the Jun 2012 $230 Call = you exercise the call, gain $20
  •         Net premium gain: $ 3.50-$1.15 = $2.35
  •         Profit: -$30+$20+$2.35=-$7.65

Stock price at $222.35...

  •         Sell the Jun 2012 $220 Call = Call exercised by call buyer, loss $2.35
  •         Buy the Jun 2012 $230 Call = Out-of-the money, $0
  •         Net premium gain: $ 3.50-$1.15 = $2.35
  •         Profit: $0

Stock Price fall to $200...

  •         Sell the Jun 2012 $220 Call = Call not exercised
  •         Buy the Jun 2012 $230 Call = Out-of-the money, $0
  •         Net premium gain: $ 3.50-$1.15 = $2.35
  •         Profit: $2.35

Bear Call Spread

Advantages...
  •     Short-term immediate income, net premium = $2.35,
  •     Capped upside protection. (No matter how high  the price rises, loss in Buying and Selling Put is locked  to difference in strikes [$230-$220=$10])

Disadvantage...

  •     Capped downside if the stock fall. (No matter how further stock price falls, you maximum profit limit to net premium gain=$2.35)

Maximum Profit:    $3.50-$1.15=$2.35
                              (premium received - premium paid = net premium gain)

Maximum Loss:     ($230-$220)-$2.35=$7.65
                              (Different in strike - net premium gain)         

Breakeven:           $220+$2.35=$22.35
                              (Lower strike + net premium gain)


Bull Put Spread

Outlook: Bullish or Neutral to Bullish

Bull Put Spread - Buy lower strike Put, Sell higher strike Put

Strategies...
  • Buy lower strike put
  • Sell same number of higher strike puts with the same expiration date.
  • Ensure trend is upward
  • Preferably with one month or less to expiration
Example...

VeriFone Systems Inc (NYSE:PAY) is trading at $38 on May 26, 2012.

  •     Buy the Jun 2012 $33 put option for $0.35.
  •     Sell the Jun 2012 $37 put option for $1.20.

Bull Put Spread


Why Buy Jun $33 Put? You have right to sell the stock at $33 if stock price fall. 

Why Sell Jun $37 Put? Capped downside risk. Jun $37 Put will not be exercised if price fall lower than $37.

How does Bull Put Spread work?

Stock price rise to $40.00...(or higher)


  •     Buy the Jun 2012 $33 Put = Out-of-the-money, $0
  •     Sell the Jun 2012 $37 Put = Put not exercise, premium gain=$1.20
  •     Net premium gain: $ 1.20 - $0.35 = $0.85 
  •     Profit: $0.85


Stock price at $36.15...

  •     Buy the Jun 2012 $33 Put = at-the-money, $0
  •     Sell the Jun 2012 $37 Put = Put exercised, loss $0.85
  •     Net premium gain: $ 1.20 - $0.35 = $0.85
  •     Profit : $0


Stock Price fall to $30...

  •     Buy the Jun 2012 $33 Put = In-the-money, gain $3
  •     Sell the Jun 2012 $37 Put = Put exercised, loss $7
  •     Net premium gain: $ 1.20 - $0.35 = $0.85
  •     Profit : $3-$7+$0.85= -$3.15
  •  
Bull Put Spread


Advantages...
  • Short-term immediate income, net premium = $0.85,
  • Capped downside protection. (No matter how further price goes down, maximum loss in Buying and Selling Put is locked to the difference in strikes $37-$33=$4)

Disadvantage...
  • Capped upside if the stock rises.(No matter how high stock price rise, you maximum profit cap to net premium gain=$0.85)

Maximum Profit:    $1.20-$0.35=$0.85
                              (premium received - premium paid = net premium gain)

Maximum Loss:     $37-$33+$0.85=$3.15
                              (Different in strike + net premium gain)          

Breakeven:           $37-$0.85=$36.15
                              (Higher strike - net premium gain)


Bear Put Spread

Outlook: Bearish

Bear Put Spread - Buy Higher Strike Put,  Sell Lower Strike Put


Strategies...
  • Sell lower strike put
  • Buy same number of higher strike puts with the same expiration date.(either ATM or sightly OTM)
  • Downward Trend

Example...

Hewlett-Packard Company (NYSE:HPQ) is trading at $22.50 on May 26, 2012.

    Buy the Nov 2012 $22 put option for $2.10
    Sell the Nov 2012 $17 put option for $0.55.


You're bearish on this stock, so you bought Nov 2012 $22 put.

Why Buy a Put?  Buying a puts will cap your downside. If price goes down, you have the right to sell your stock at price $22.

Why Write/Sell a Put? Selling a put means you expect stock price rise or remains sideways in the next few months. You'll receive premium $0.55 by writing a put, and now your maximum risk has reduced to $1.55 per share.

Bear Put Spread


How does Bear Put Spread work? 

Stock price fall to $17.00... 
  • Buying Nov $22 Put Option = In-the-money $5.00,
  • Selling Nov $17 Put Option = At-the-money, $0
  • Net premium paid: $ 2.10 - $0.55 = $1.55 
  •  Profit : $5.00 - $1.55 = $3.45

Stock price fall to $20.45...
  • Buying Nov $22 Put Option = In-the-money, gain $1.55
  • Selling Nov $17 Put Option = Put not exercise by Put Buyer, $0
  • Net premium paid: $ 2.10 - $0.55 = $1.55,
  • Profit : $1.55-$1.55=$0

Stock Price rise to $23.00...
  •  Buying Nov $22 Put Option = Out-of-the-money, $0
  •  Selling Nov $17 Put Option = Put not exercise by Put Buyer, $0
  •  Net premium paid: $ 2.10 - $0.55 = $1.55
  • Profit: -$1.55

Bear Put Spread
 

Disadvantage... Capped upside profit if the stock falls.

Maximum Loss:     $2.10-$0.55=$1.55
                               (premium paid - premium received = net paid)


Maximum Profit:    ($22.00 - $17.00)-$1.55=$3.45
                              (Different in strike - net paid)

Breakeven:           $22.00-$1.55=$20.45
                              (Higher strike - net paid)